
Learn how to use automation to move your advisory services up the value chain
By Chris Hervochon, originally published by SCACPA.org
CPAs are fighting automation and commoditization. “Advisory” is the buzzword, and we are constantly being told our services need to move up the value chain. We can do this is by helping our clients understand and utilize the data in their business to drive efficiency and profitability.
While businesses might have many different data sources, let’s explore how we might utilize point of sale data to create efficiencies and inform other areas of the business.
Our Starting Point
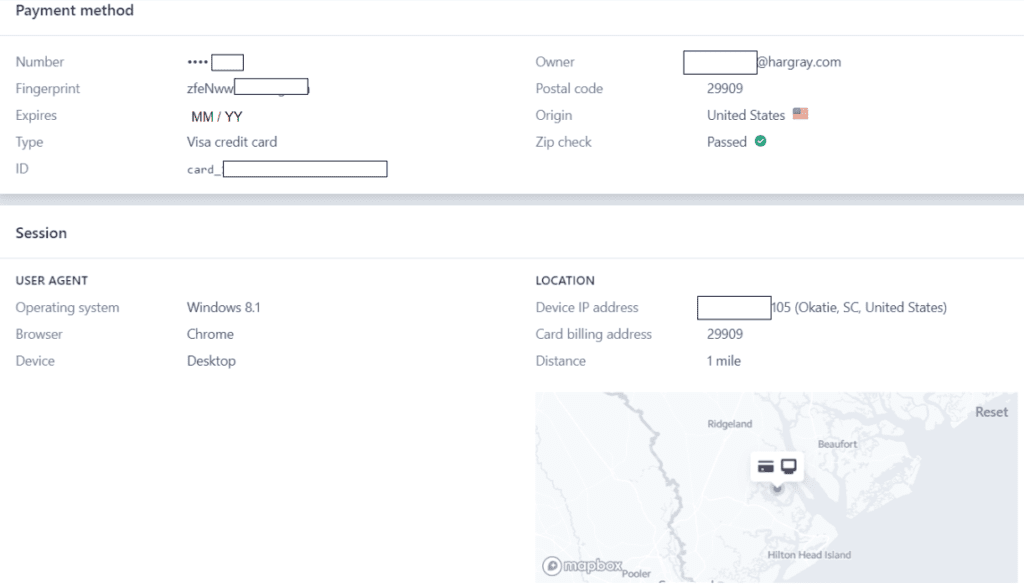
Let’s consider an example using Stripe. Odds are you have or had a client who uses Stripe, Square or something similar as their point of sale. “Point of sale” does not necessarily mean a physical cash register, it could mean a website form or electronic invoice. Here are examples of data generated by Stripe when an online donation is made to a nonprofit:
Capturing the Data
As you can see from the two screenshots, there is an incredible amount of data that can be of use: gross sale amount, date of sale, processing fee, credit card type, IP address, device used, zip code and how far away from the business the user was when the donation was made.
These are fairly standard data fields that will be captured with a purchase, but the business can augment these fields with others. For example, the user could be asked to complete an online form during the time of purchase.
Putting Accounting Automation to Use

If your firm or your client uses QuickBooks Online and Stripe, you might already know there is no native integration between the platforms. Given the example above, the only data your client is likely to see is a $4.55 transaction in the Bank Feed, all of which will likely be booked to revenue. From a business management and financial reporting perspective, we’d like to see $5.00 in revenue and $0.45 stated separately as an expense.
Several third-party apps can bridge the gap. Another option is to utilize a service such as Zapier to update QuickBooks Online each time a new payment is processed. Using this option, it’s possible to create a customer in QuickBooks Online, plus a Sales Receipt that itemizes the products and services sold as well as the processing fee. From there, it’s a simple “matching” exercise within the Bank Feed in QuickBooks Online.
Regardless of which method is used, the goal should be to itemize gross revenue at an appropriate level and to have the processing fees separately stated. This will help you and the business owner to identify possible alternative payment methods, customer profitability and product or service profitability.

Increased Insights
The example data can also help answer these questions:
- How much am I paying in transaction fees per year?
- How much is my average sale?
- Where are my clients physically located?
- How do my clients interface with my business online?
The first two are questions any accountant should be able to answer for a client. Or, a client should be able to answer for themselves, possibly. However, the third and fourth questions dive a bit deeper.
For example, a lot of advertising is now done online via social media. If we think of the third question within the context of Facebook ads, we can now advise our client’s marketing team as to which geographic locations they should target their ads to. This should help to reduce overall ad spend and simultaneously increase return on ad spend. Taken a step further, consider the resort town of Hilton Head Island, where I live. If my client owns a restaurant and sees an increase in transactions from Ohioans every June through August, we can advise them to consider running ads starting in May to people from Ohio promoting the restaurant in advance of their upcoming vacation.
In considering the fourth question, it might be helpful to know if people are buying via desktop or mobile. This can help to inform customer demographics and assist the marketing team in understanding the buyer’s journey. Perhaps the data will tell us most of the traffic to the website occurs from a mobile device, but the purchases are occurring from a desktop. This information will be useful to the marketing team.
Certainly, there are more questions we can answer for our clients based on this type of data. This is just a start. Ideally, the answers will be presented graphically, in the form of a dashboard. Graphical representations of data are much easier to digest, and in a lot of cases, help to provide more context than just numbers on a spreadsheet.
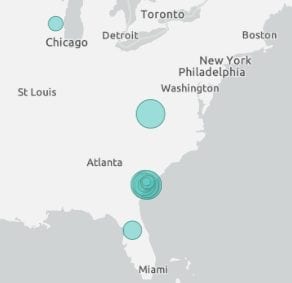
A depiction of where customers are physically located might be presented in the form of a map visualization on a dashboard.
The donor dataset for this nonprofit is fairly localized. Note from the graphic of the eastern half of the United States that we received donations from Virginia, Wisconsin and Florida. We determine this to be interesting, but likely not actionable for this organization.
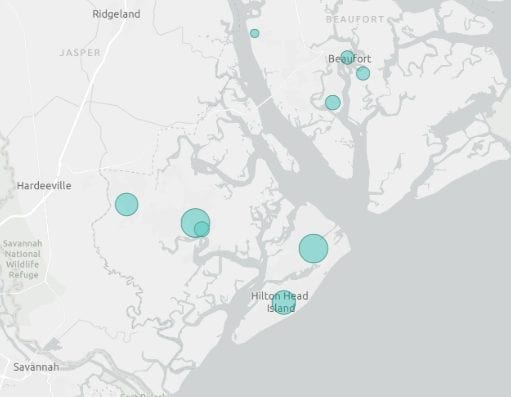
Since we are utilizing a dashboard, we are able to drill down on the local area. In doing so, it becomes clear our local fundraising efforts are likely better spent in Hilton Head and Bluffton more so than Ridgeland or Savannah.
Bringing it all together
Our clients are increasingly using software to create efficiencies in their business. They are also creating more data – data CPAs can easily access and leverage to move ourselves up the value chain of services we provide while simultaneously increasing the benefits we provide to our clients.
Utilizing our client’s point of sale data is a good example of a rich dataset we can easily leverage for better and more complete financial statements with less effort via automation. Additionally, it will allow our clients to make strategic decisions that were previously unavailable or prohibitively difficult to determine.